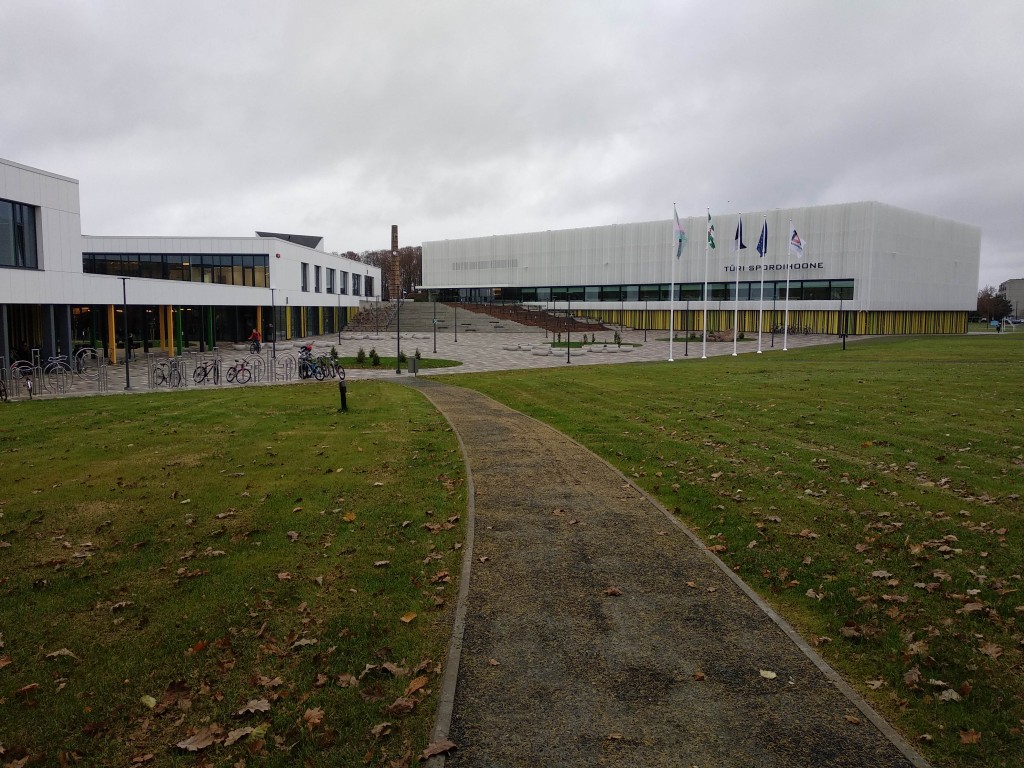
Järva County shows the highest level of all services with 69 points. Compared to other counties, Järva County stands out in the field of sports, where all the local governments of the county offer at least 10 different sports opportunity to children, and the development of the entire field is also monitored. In addition, Järva County has an average high level in water management, where each municipality has a leak detection system and wastewater treatment indicators meet higher environmental protection requirements [1]. Harju and Jõgeva counties are also in the lead. The gap in the field of museums in Lääne County is due to the fact that there are no museums owned by the municipalities and therefore the level of service cannot be assessed. Excluding the results of the museum field, Lääne County would get the sixth result instead of the seventh. The lowest aggregate level is in Valga County, where the average service level in seven areas is below three or the basic level.
The level of services in 16 areas has been assessed in the same way as in 2018 - with a total of about 300 criteria. We find the strongest and weakest areas according to the average service levels. The level of service is determined according to the criteria met. The criteria are divided into three groups in descending order of importance: base, advanced and exemplary level.
Regardless of the higher level of youth work and water management in comparison with other fields, it is not appropriate to compare the averages between the fields. For example, in youth work, there is also the biggest difference between the average county service levels, which indicates that the service is also provided more unevenly across counties. The area of the museum is clearly different, where the very low grade is mostly due to the non-submission of data.
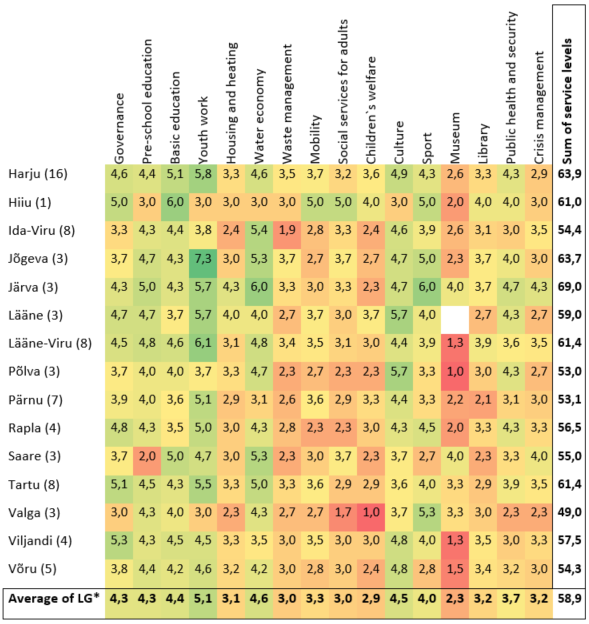
In addition to the current situation, it is also important to look at the changes in service levels that have taken place during the year. The magnitude of the changes gives an idea of both county and sectoral directions. The biggest positive changes have taken place in Järva, Lääne-Viru and Hiiu counties, where the total service level of all areas per municipality has increased by three notches. Also worth mentioning are Ida-Viru, Pärnu and Rapla counties, where the average increase has been 2.2; 2.0 and 2.0 service levels respectively. As can be seen from the table below, the biggest positive change has taken place in the field of water management, where the treatment capacity of wastewater treatment plants in municipalities has improved and a better overview of leak-free and inflation-free public sewerage pipelines. In addition, it is good to see an increase in adult social welfare service level, where the increase has been caused by the improvement of the qualification requirements for the staff of general care homes.
The level of service alone does not highlight the strengths or bottlenecks of emerging areas. It is therefore wise to look in more detail at what is well and what are the main problems. It is reasonable to look for all-Estonian strengths from exemplary level criteria, from which we find that:
- all local governments have received support for at least two projects for the improvement of housing and settlement environment in the local government during the last three years (Housing and heating);;
- in each local government there are at least 10 participants per 1000 inhabitants in folk culture collectives (Culture);
- In 74 local governments, officials have at least the average salary of all officials or 1.2 times the average salary of local government residents (Governance);
- In 73 local governments, the net debt burden is below the ceiling and the ratio of the net debt burden to the operating result is less than 8 (Governance);
- In 73 municipalities children's institutions have websites (Basic Education);
- In 71 municipalities, at least 95% of regular drinking water meets the quality requirements for drinking water for regular consumers (Water economy);
- 70 local governments have a commission on youth work (Youth Work);
The conditions fulfilled by the above municipalities show that we are successful in certain things and we are able to ensure them well. It gives confidence that we are moving in the right direction, but there are still some deficits nationwide:
- crisis-related codes of conduct and daily information for the population can be found in only 5 local governments (Crisis management);
- only 75% of building and use permits issued in 9 local governments during the term (Housing and heating);
- 75% of design conditions issued within the term in only 15 local governments (Housing and heating);
- only 20 municipalities have a library development plan (Library);
- only in 21 local governments in water management overview of local treatment systems (Water economy);
In summary, we can say that the area with the highest level of service in our local governments is youth work. Compared to 2018, there has been a large increase in 2019 in the field of water management and adult social welfare, where the availability of data has improved in the former and the qualification requirements for employees in the latter.
[1] At least 90% of the effluent complies with the BOD7 and COD7 pollution load standards for large water mains (2000 ie)
* The analysis and preparation of the article is supported by the European Social Fund of the European Union.