ATS AASMAA, DATA ANALYST AT THE MINISTRY OF FINANCE
According to the Organization for Economic Co-operation and Development (OECD) Local Government Performance Report, comparing services is one of the ways to improve public services. The OECD also considers that the purpose of service benchmarking is to map vulnerabilities and gain knowledge about the best service providers.*
Based on 261 criteria, 16 offered services have been evaluated on a 10-point scale. The criteria are divided into basic, advanced and exemplary levels. Basic level represents the basic expectations that a local government must meet. If the basic level requirements are met, the local government will achieve a service level of at least 3. Advanced and exemplary level measure the additional efforts of local governments in developing services. By meeting these higher criteria, it is possible to reach the service level of up to 9. A more detailed overview of the assessment of service levels can be found on the sub-page describing the methodology.
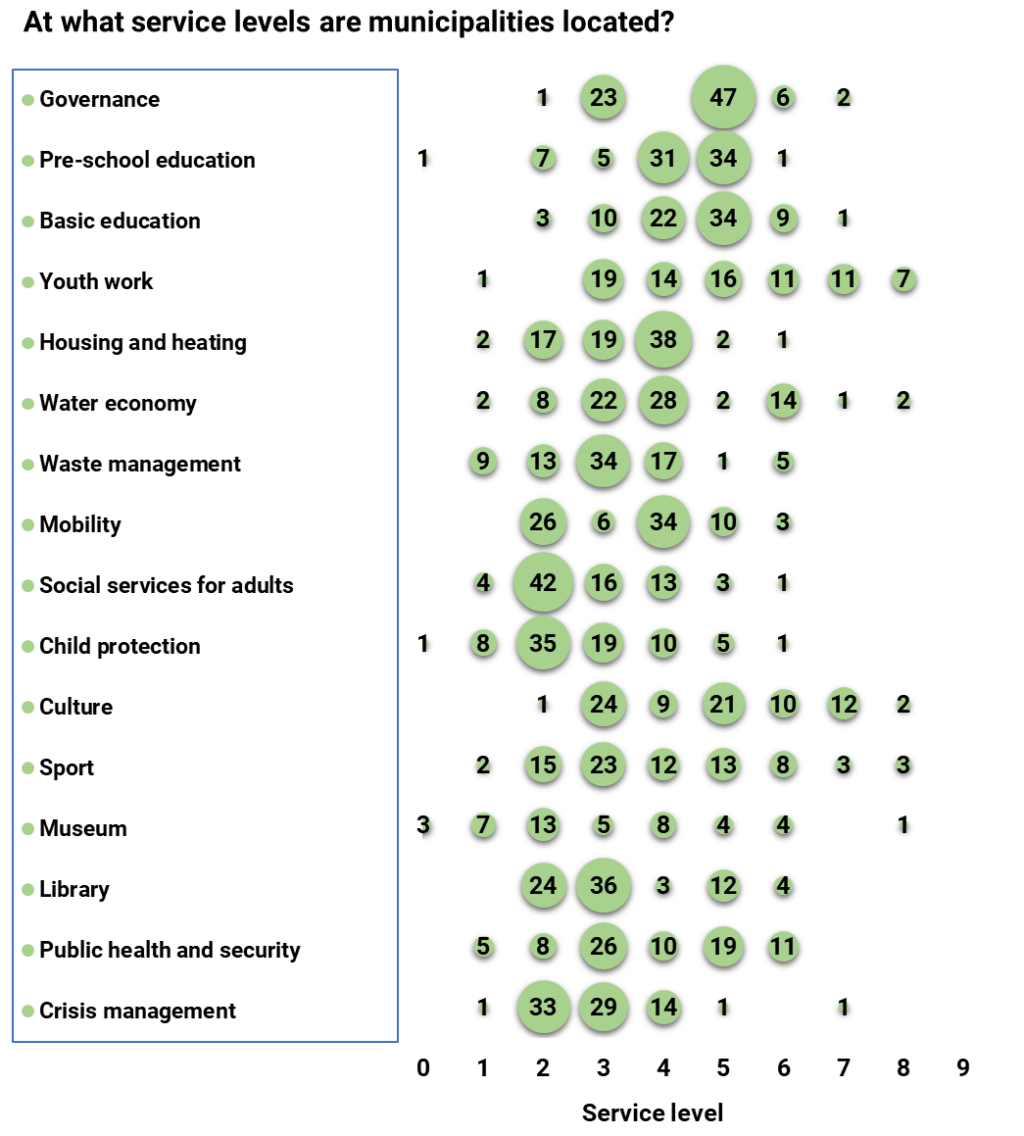
The results of the fulfillment of the basic level differ both by areas and by local governments. While 76 municipalities achieve at least the expected baseline, i.e. level 3, in the areas of governance, youth work, basic education and culture, significantly fewer municipalities reach baseline levels in the areas of crisis preparedness, child welfare and adult social welfare - 45, 35 and 33, respectively. Museums service level criterias can be fulfilled by 45 local governments, of which 22 or 49% meet the basic level. In the field of the lowest completed, adult social welfare, 58% of local governments did not meet the expected basic level.
If we look at the all-Estonian average fulfillment of the criteria in all fields, then youth work (71.5%), culture (70.9%), government (62.9%) and basic education (62.5%) do best. The areas of adult social welfare (48%), child welfare (48%) and museums (48%) are lower. The general fulfillment of the criteria is as expected - the results obtained are directly related to the number of local governments reaching the basic level.
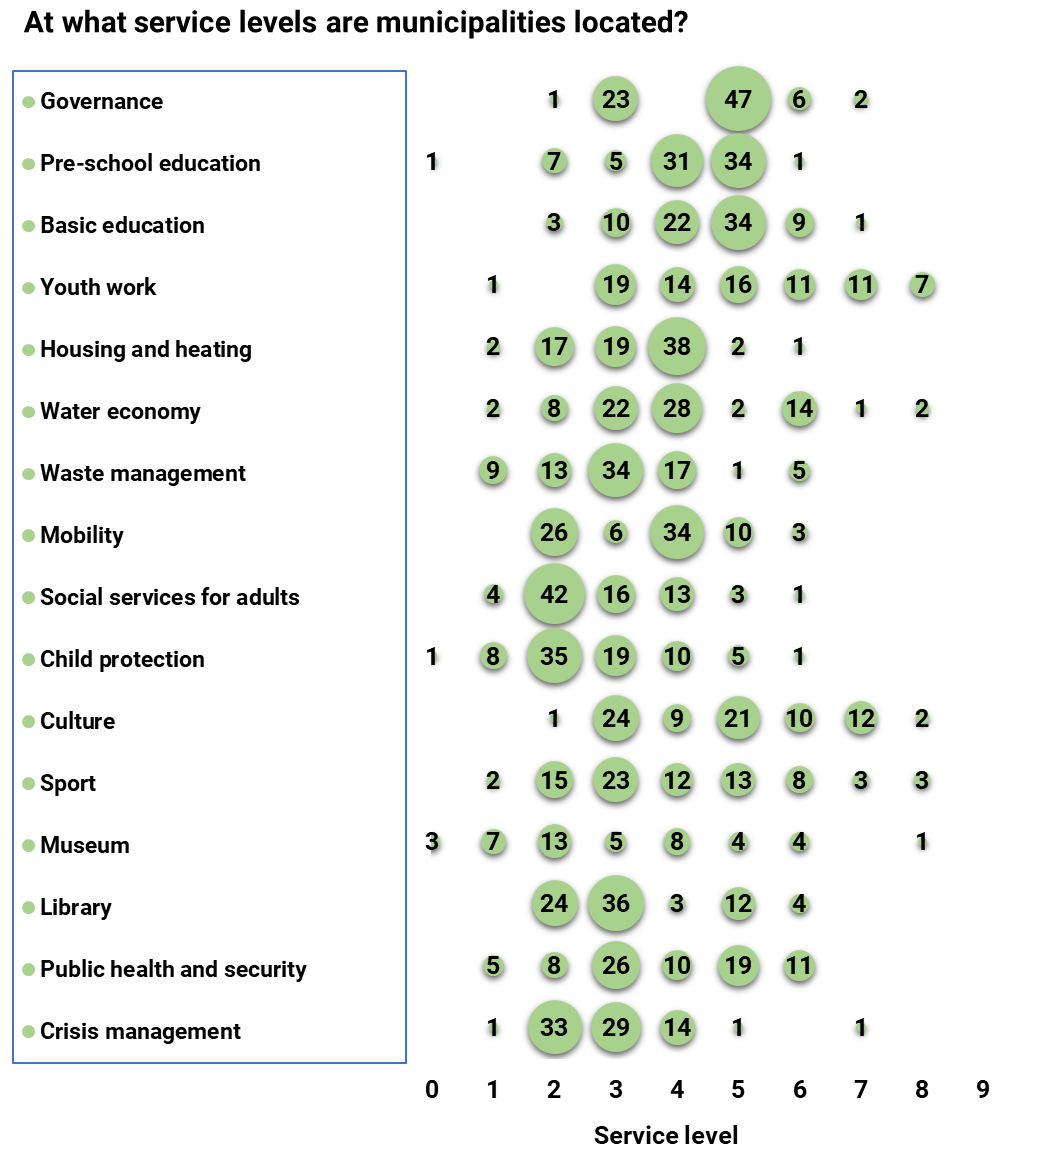
We can see from the graph that children's well-being, adults' social welfare and crisis preparedness are the areas that need the most help all over Estonia. At the same time, we also get an idea that the service level of youth work and basic education is evenly distributed among local governments, ie there are fewer low and high results and more average results (with some exceptions). It is worth noting that in the areas of governance, culture and mobility, the division of service levels seems to be with two hunches - for example, the third and fifth levels of government are filled the most, while there is no local government at the fourth level. No fundamental conclusions can be drawn from this, but the results provide food for thought as to whether local governments face a barrier to meeting certain levels or whether the “empty level of service” is rather the result of evaluation criteria.
The service evaluation model and website have given a new dimension to measuring the quality of services provided to both local governments and residents. In the coming years, the evaluation model will be supplemented with new criteria, which, together with the 2019 data to be entered this autumn, will allow for even more in-depth analyzes and more concrete conclusions.
* Phillips, L. (2018), "Improving the Performance of Sub-national Governments through Benchmarking and Performance Reporting," OECD Working Papers on Fiscal Federalism, no. 22, OECD Publishing, Paris, https://doi.org/10.1787/ffff92c6-en.
** The analysis and preparation of the article is supported by the European Social Fund of the European Union.